How Bayesian studies include prior information

April 27, 2026
Author: Miguel Pereira
Since the FDA’s Guidance for Bayesian methods in clinical trial was released, there have been a lot of LinkedIn post and articles talking about all the issues with prior information. From the use of non-informative priors when there is "no information" to the use of priors that are "too informative" as that bias the results, there is a range of opinions on the use of prior information. But how can prior information actually be included in a study?
This is the 2-min illustrative example that I usually use in my talks.
Imagine we want to estimate the percentage of people in the population that has diabetes.
The study itself is very simple (regardless of how of we will analyse our data):
- Collect a sample of, say, 500 people
- Test if they have received a diagnosis of diabetes and/or are taking medication to treat diabetes
- Note down the number of people with diabetes
Let’s say that in our study we observed 40 people diagnosed with diabetes out of our sample of 500 people, which corresponds to a prevalence of 8%. Usually, we would also present a measure of how sure we are that the prevalence is 8%
Using the usual analysis approach, we would:
- Calculate the prevalence (40/500 = 8%)
- Calculate a confidence interval - in this case, the exact 95% confidence interval is [5.8%, 10.7%]
From a Bayesian perspective, we would:
- Start by defining our prior knowledge about diabetes prevalence → this always happens before the experiment starts
- Update this prior with our observed data - 40 diabetics in 500 people
- Calculate a credible interval for the true prevalence of diabetes
Prior information
Now to the prior information:
One very simple way of leveraging prior information is to say: "I am ~80% sure that the prevalence of diabetes is below 50%"
This is, arguably, a fair assumption. To support it, we can use estimates from previous years or different populations (e.g. from similar countries). Even if these are not available, we also know empirically that 50% of the people walking about do not have diabetes - at least not yet....
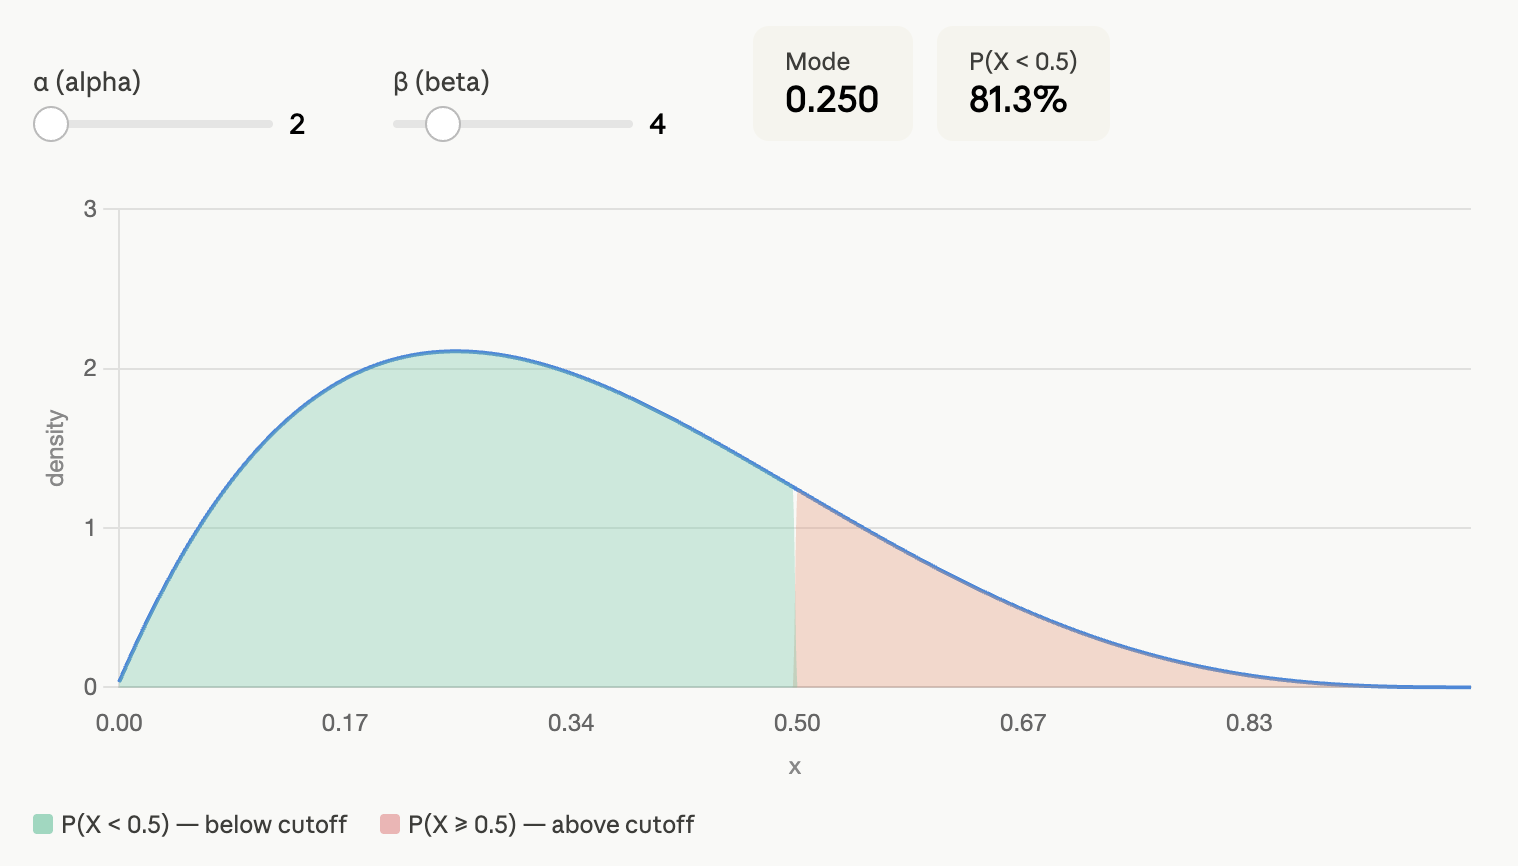
The Bayesian "magic" consists in translating this prior belief that we are 80% sure that the prevalence of diabetes is below 50% into something mathematical. Without getting too technical, I can translate our assumption into a Beta distribution, Beta(2, 4). Under this assumption, we are 81.4% sure that the prevalence of diabetes is below 50%:
If we use this prior information, the posterior 95% credible interval is [6.1%, 10.9%].
This would be an example of a minimally informative prior. We use some information that is defensible and integrate it into our estimation.
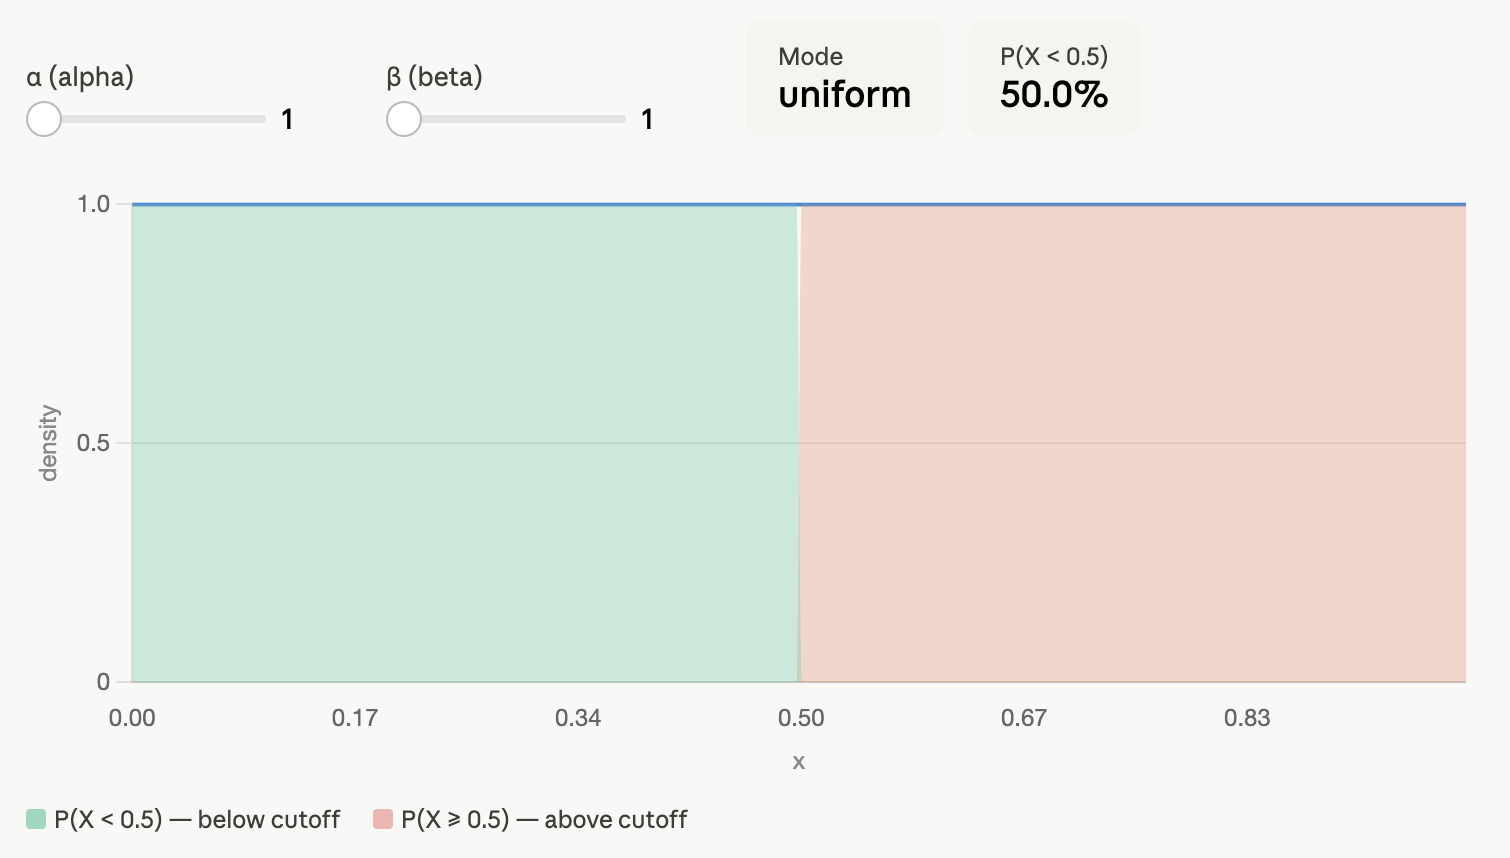
You could also say that you don’t want to commit yourself to any assumptions and still do a Bayesian analysis. That’s fine. We can assume that the prevalence of diabetes can be any value between 0 and 100% with equal probability. This corresponds to a Beta(1, 1) prior:
If you use this non-informative prior as prior information, the posterior 95% credible interval is [5.8%, 10.7%] - the same we obtain using the exact confidence interval!
Final note on interpreting Confidence Intervals vs. Credible Intervals
Although Confidence Intervals and Credible Intervals seem to the frequentist and Bayesian counterparts of the same thing, their interpretation is quite different:
- The 95% confidence interval tells us that if we collect 100 independent samples of the population, in at least 95 of them, the prevalence will be between 5.8 and 10.7%
- The 95% credible interval tell us that there is a 95% probability that the prevalence of diabetes is between 6.1% and 10.9% given our initial prior information.
Neither of these is necessarily better than the other. It mainly comes down to what is the question we are asking, how we want to interpret our results and how will we use this data in the future (e.g. future studies, predictive models, etc).
#pharma #biotech #clinicaltrials #biostatistics #cogitars